A carbon sink is a natural or artificial process that "removes a greenhouse gas, an aerosol or a precursor of a greenhouse gas from the atmosphere". These sinks form an important part of the natural carbon cycle. An overarching term is carbon pool, which is all the places where carbon on Earth can be, i.e. the atmosphere, oceans, soil, plants, and so forth. A carbon sink is a type of carbon pool that has the capability to take up more carbon from the atmosphere than it releases.
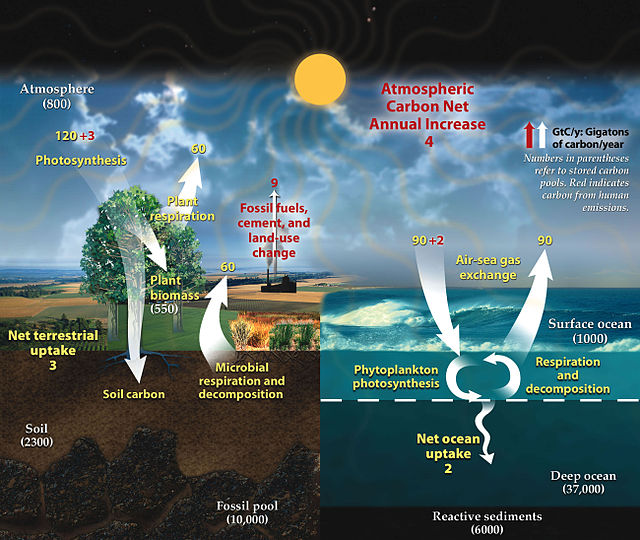
This diagram of the fast carbon cycle shows the movement of carbon between land, atmosphere, soil and oceans in billions of tons of carbon per year. Yellow numbers are natural fluxes, red are human contributions in billions of tons of carbon per year. White numbers indicate stored carbon.
Reforestation and reducing deforestation can increase carbon sequestration in several ways. Pandani (Richea pandanifolia) near Lake Dobson, Mount Field National Park, Tasmania, Australia
Transferring land rights to indigenous inhabitants is argued to efficiently conserve forests.
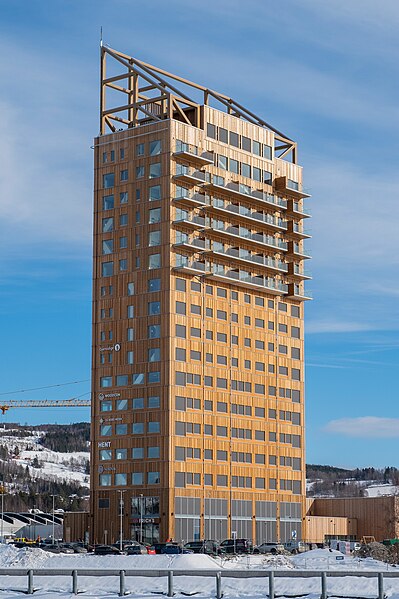
Mjøstårnet, one of the tallest timber buildings, at its opening 2019
The carbon cycle is that part of the biogeochemical cycle by which carbon is exchanged among the biosphere, pedosphere, geosphere, hydrosphere, and atmosphere of Earth. Other major biogeochemical cycles include the nitrogen cycle and the water cycle. Carbon is the main component of biological compounds as well as a major component of many minerals such as limestone. The carbon cycle comprises a sequence of events that are key to making Earth capable of sustaining life. It describes the movement of carbon as it is recycled and reused throughout the biosphere, as well as long-term processes of carbon sequestration (storage) to and release from carbon sinks.
Fast carbon cycle showing the movement of carbon between land, atmosphere, and oceans in billions of tons (gigatons) per year. Yellow numbers are natural fluxes, red are human contributions, and white are stored carbon. The effects of the slow (or deep) carbon cycle, such as volcanic and tectonic activity are not included.
A portable soil respiration system measuring soil CO2 flux.
Where terrestrial carbon goes when water flows
How carbon moves from inland waters to the ocean Carbon dioxide exchange, photosynthetic production and respiration of terrestrial vegetation, rock weathering, and sedimentation occur in terrestrial ecosystems. Carbon transports to the ocean through the land-river-estuary continuum in the form of organic carbon and inorganic carbon. Carbon exchange at the air-water interface, transportation, transformation and sedimentation occur in oceanic ecosystems.


