Between 1901 and 2018, average global sea level rose by 15–25 cm (6–10 in), an average of 1–2 mm (0.039–0.079 in) per year. This rate accelerated to 4.62 mm (0.182 in)/yr for the decade 2013–2022. Climate change due to human activities is the main cause. Between 1993 and 2018, thermal expansion of water accounted for 42% of sea level rise. Melting temperate glaciers accounted for 21%, while polar glaciers in Greenland accounted for 15% and those in Antarctica for 8%.
Jason-1 continued the sea surface measurements started by TOPEX/Poseidon. It was followed by the Ocean Surface Topography Mission on Jason-2, and by Jason-3.
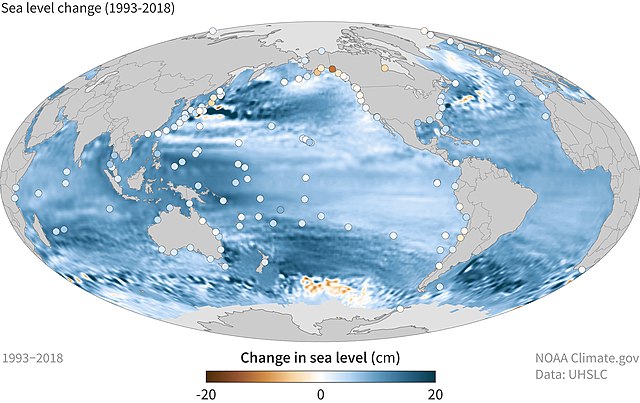
Between 1993 and 2018, the mean sea level has risen across most of the world ocean (blue colors).
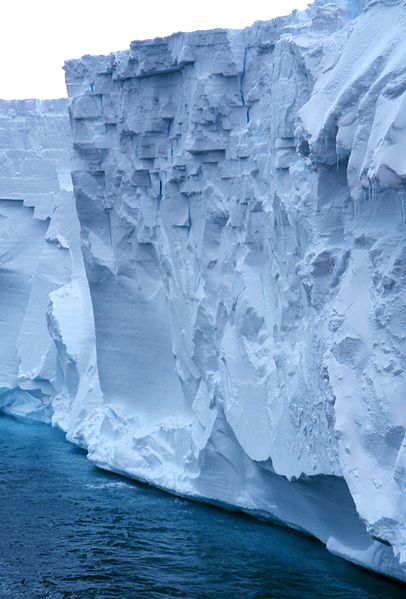
The Ross Ice Shelf is Antarctica's largest. It is about the size of France and up to several hundred metres thick.
Thwaites Glacier, with its vulnerable bedrock topography visible.
Mean sea level is an average surface level of one or more among Earth's coastal bodies of water from which heights such as elevation may be measured. The global MSL is a type of vertical datum – a standardised geodetic datum – that is used, for example, as a chart datum in cartography and marine navigation, or, in aviation, as the standard sea level at which atmospheric pressure is measured to calibrate altitude and, consequently, aircraft flight levels. A common and relatively straightforward mean sea-level standard is instead a long-term average of tide gauge readings at a particular reference location.
This marker indicating sea level is situated between Jerusalem and the Dead Sea.
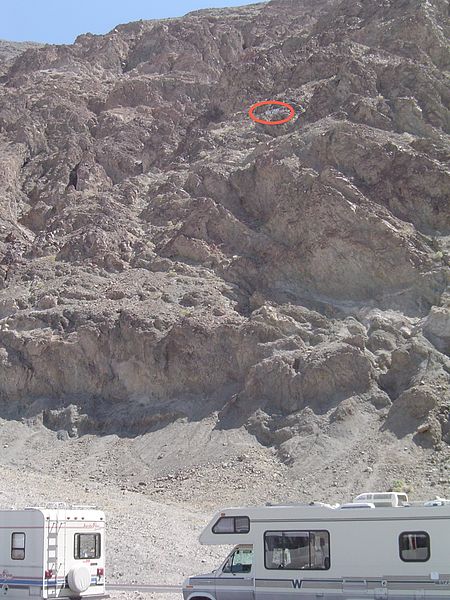
Sea level sign seen on cliff (circled in red) at Badwater Basin, Death Valley National Park
The Last Glacial Period caused a much lower global sea level.
Warming temperatures and melting glaciers are currently raising the sea level.