A 100-year flood is a flood event that has on average a 1 in 100 chance of being equaled or exceeded in any given year.
Mississippi River at Kaskaskia, Illinois, during the Great Flood of 1993
High-water scale 1501–2002 at Passau, Germany, as of September 2012
A flood is an overflow of water that submerges land that is usually dry. In the sense of "flowing water", the word may also be applied to the inflow of the tide. Floods are of significant concern in agriculture, civil engineering and public health. Human changes to the environment often increase the intensity and frequency of flooding. Examples for human changes are land use changes such as deforestation and removal of wetlands, changes in waterway course or flood controls such as with levees. Global environmental issues also influence causes of floods, namely climate change which causes an intensification of the water cycle and sea level rise. For example, climate change makes extreme weather events more frequent and stronger. This leads to more intense floods and increased flood risk.
Urban flooding in a street in Morpeth, England
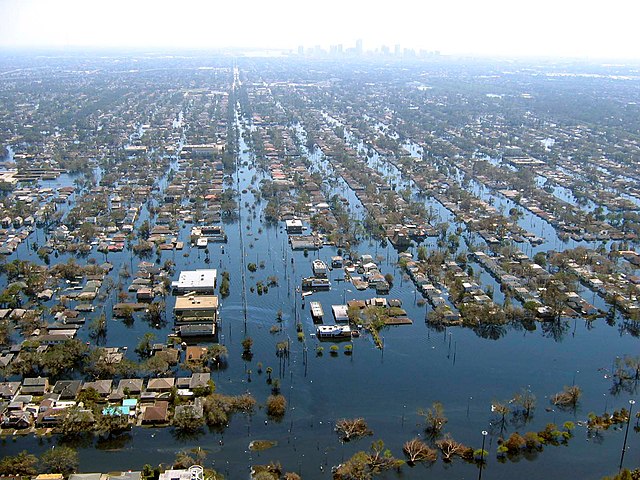
View of flooded New Orleans in the aftermath of Hurricane Katrina
Flooding of a creek due to heavy monsoonal rain and high tide in Darwin, Northern Territory, Australia
Flood in Jeddah, covering the King Abdullah Street in Saudi Arabia