Antarctic ice sheet
Videos
The Antarctic ice sheet is a continental glacier covering 98% of the Antarctic continent, with an area of 14 million square kilometres and an average thickness of over 2 kilometres. It is the largest

South facing visualization of the Antarctic ice sheet from the Pacific sector of the Southern Ocean (West Antarctic Ice Sheet, foreground; Antarctic Peninsula, to the left; East Antarctic Ice Sheet, background).

Parts of East Antarctica (marked in blue) are the only places on Earth to experience negative greenhouse effect regularly during certain months of the year. At greater warming levels, the effect is likely to disappear because of increasing concentrations of water vapor over Antarctica.

Antarctic surface temperature trends, in °C per decade. Red represents areas where temperatures have increased the most since the 1950s.

East Antarctica cooled in the 1980s and the 1990s even as West Antarctica warmed (left-hand side). That trend largely reversed in the 2000s and the 2010s (right-hand side).
Sea level rise
Videos
The sea level has been rising since the end of the Last Glacial Maximum, which was around 20,000 years ago. Between 1901 and 2018, the average sea level rose by 15–25 cm, with an increase of 2.3 mm pe

Sea level rise for the low-emission, high-emission (RCP 8.5, lower left) and in-between scenarios according to the different approaches. Projections are very similar for low warming, but disagreement increases alongside the temperature

Jason-1 continued the sea surface measurements started by TOPEX/Poseidon. It was followed by the Ocean Surface Topography Mission on Jason-2, and by Jason-3.

Between 1993 and 2018, the mean sea level has risen across most of the world ocean (blue colors).
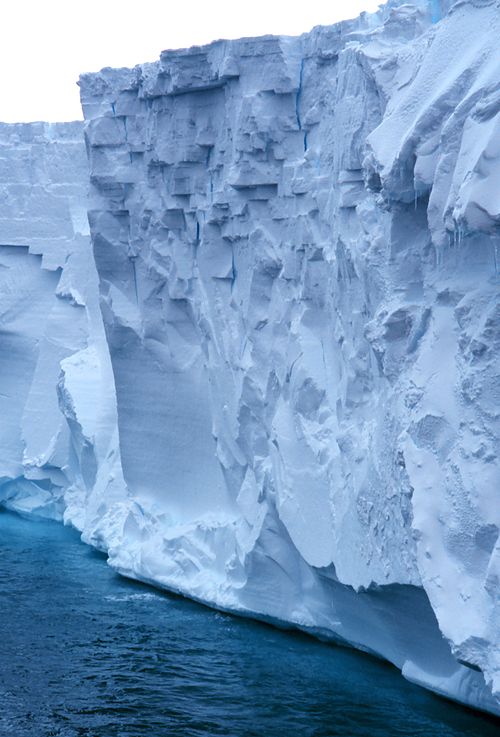
The Ross Ice Shelf is Antarctica's largest. It is about the size of France and up to several hundred metres thick.