Central limit theorem
Videos
In probability theory, the central limit theorem states that, under appropriate conditions, the distribution of a normalized version of the sample mean converges to a standard normal distribution. Thi
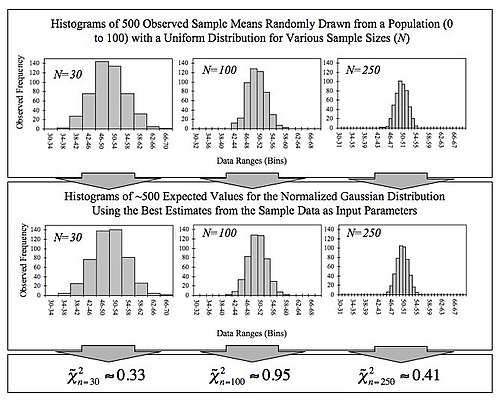
This figure demonstrates the central limit theorem. The sample means are generated using a random number generator, which draws numbers between 0 and 100 from a uniform probability distribution. It illustrates that increasing sample sizes result in the 500 measured sample means being more closely distributed about the population mean (50 in this case). It also compares the observed distributions with the distributions that would be expected for a normalized Gaussian distribution, and shows the
Aleksandr Lyapunov
Videos
Aleksandr Mikhailovich Lyapunov was a Russian mathematician, mechanician and physicist. He was the son of the astronomer Mikhail Lyapunov and the brother of the pianist and composer Sergei Lyapunov.
Central limit theorem
…was not until the nineteenth century was at an end that the importance of the central limit theorem was discerned, when, in 1901, Russian mathematician Aleksandr Lyapunov defined it in general terms and proved precisely how it worked mathematically. Nowadays, the central limit theorem is considered to be the unofficial…

Alexander Ljapunow jung

Aleksandr Lyapunov in 1908