Data and information visualization is the practice of designing and creating easy-to-communicate and easy-to-understand graphic or visual representations of a large amount of complex quantitative and qualitative data and information with the help of static, dynamic or interactive visual items. Typically based on data and information collected from a certain domain of expertise, these visualizations are intended for a broader audience to help them visually explore and discover, quickly understand, interpret and gain important insights into otherwise difficult-to-identify structures, relationships, correlations, local and global patterns, trends, variations, constancy, clusters, outliers and unusual groupings within data. When intended for the general public to convey a concise version of known, specific information in a clear and engaging manner, it is typically called information graphics.

Scatter plot

Iconography of correlations
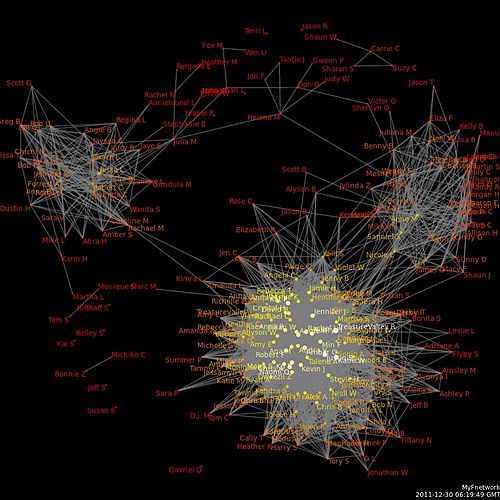
A data visualization from social media

Bar chart of tips by day of week
Scientific visualization
Videos
Scientific visualization is an interdisciplinary branch of science concerned with the visualization of scientific phenomena. It is also considered a subset of computer graphics, a branch of computer science. The purpose of scientific visualization is to graphically illustrate scientific data to enable scientists to understand, illustrate, and glean insight from their data. Research into how people read and misread various types of visualizations is helping to determine what types and features of visualizations are most understandable and effective in conveying information.

A scientific visualization of a simulation of a Rayleigh–Taylor instability caused by two mixing fluids.

Surface rendering of Arabidopsis thaliana pollen grains with confocal microscope.

Scientific visualization of Fluid Flow: Surface waves in water

Chemical imaging of a simultaneous release of SF6 and NH3.