The elevation of a geographic location is its height above or below a fixed reference point, most commonly a reference geoid, a mathematical model of the Earth's sea level as an equipotential gravitational surface .
The term elevation is mainly used when referring to points on the Earth's surface, while altitude or geopotential height is used for points above the surface, such as an aircraft in flight or a spacecraft in orbit, and depth is used for points below the surface.
Processed LiDAR point cloud showing not only elevation, but heights of features as well.[citation needed][clarification needed]
Sign at 8,000 feet (2,438 m) in the San Bernardino Mountains of southern California (2009)
Landsat Image over SRTM Elevation by NASA, showing the Cape Peninsula and Cape of Good Hope, South Africa in the foreground.[1]
Mean sea level is an average surface level of one or more among Earth's coastal bodies of water from which heights such as elevation may be measured. The global MSL is a type of vertical datum – a standardised geodetic datum – that is used, for example, as a chart datum in cartography and marine navigation, or, in aviation, as the standard sea level at which atmospheric pressure is measured to calibrate altitude and, consequently, aircraft flight levels. A common and relatively straightforward mean sea-level standard is instead a long-term average of tide gauge readings at a particular reference location.
This marker indicating sea level is situated between Jerusalem and the Dead Sea.
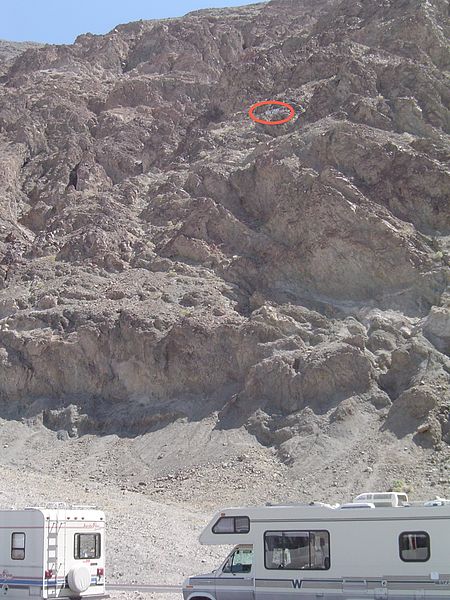
Sea level sign seen on cliff (circled in red) at Badwater Basin, Death Valley National Park
The Last Glacial Period caused a much lower global sea level.
Warming temperatures and melting glaciers are currently raising the sea level.

![Processed LiDAR point cloud showing not only elevation, but heights of features as well.[citation needed][clarification needed]](https://upload.wikimedia.org/wikipedia/commons/thumb/c/c4/Airborne_Lidar_Bathymetric_Technology.jpg/640px-Airborne_Lidar_Bathymetric_Technology.jpg)

![Landsat Image over SRTM Elevation by NASA, showing the Cape Peninsula and Cape of Good Hope, South Africa in the foreground.[1]](https://upload.wikimedia.org/wikipedia/commons/thumb/1/1d/Satellite_image_of_Cape_peninsula.jpg/640px-Satellite_image_of_Cape_peninsula.jpg)


