The emission spectrum of a chemical element or chemical compound is the spectrum of frequencies of electromagnetic radiation emitted due to electrons making a transition from a high energy state to a lower energy state. The photon energy of the emitted photons is equal to the energy difference between the two states. There are many possible electron transitions for each atom, and each transition has a specific energy difference. This collection of different transitions, leading to different radiated wavelengths, make up an emission spectrum. Each element's emission spectrum is unique. Therefore, spectroscopy can be used to identify elements in matter of unknown composition. Similarly, the emission spectra of molecules can be used in chemical analysis of substances.
A demonstration of the 589 nm D2 (left) and 590 nm D1 (right) emission sodium D lines using a wick with salt water in a flame
Spectrum (physical sciences)
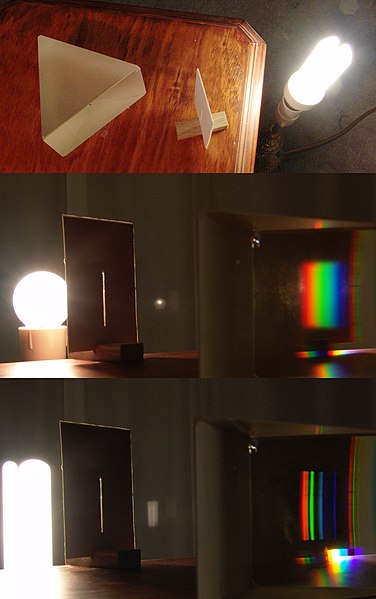
In the physical sciences, the term spectrum was introduced first into optics by Isaac Newton in the 17th century, referring to the range of colors observed when white light was dispersed through a prism.
Soon the term referred to a plot of light intensity or power as a function of frequency or wavelength, also known as a spectral density plot.
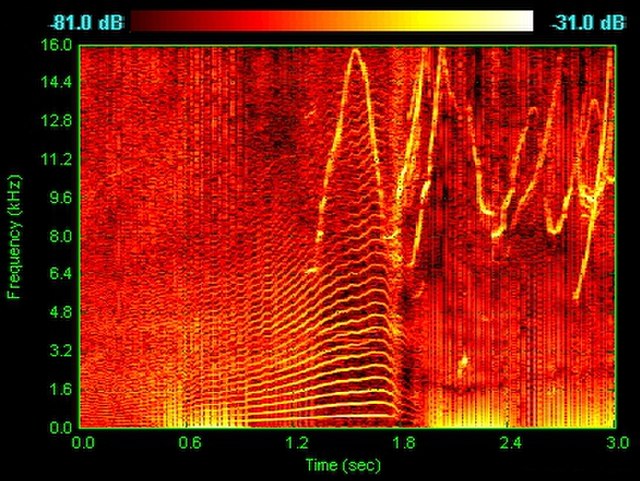
Acoustic spectrogram of the words "Oh, no!" said by a young girl, showing how the discrete spectrum of the sound (bright orange lines) changes with time (the horizontal axis)
Spectrogram of dolphin vocalizations
Continuous spectrum of an incandescent lamp (mid) and discrete spectrum lines of a fluorescent lamp (bottom)