An Euler diagram is a diagrammatic means of representing sets and their relationships. They are particularly useful for explaining complex hierarchies and overlapping definitions. They are similar to another set diagramming technique, Venn diagrams. Unlike Venn diagrams, which show all possible relations between different sets, the Euler diagram shows only relevant relationships.
The diagram to the right is from Couturat in which he labels the 8 regions of the Venn diagram. The modern name for these "regions" is minterms. These are shown in the diagram with the variables x, y, and z per Venn's drawing. The symbolism is as follows: logical AND [ & ] is represented by arithmetic multiplication, and the logical NOT [ ¬ ] is represented by " ' " after the variable, e.g. the region x'y'z is read as "(NOT x) AND (NOT y) AND
Composite of two pages from Venn (1881a), pp. 115–116 showing his example of how to convert a syllogism of three parts into his type of diagram. Venn calls the circles "Eulerian circles".
An Euler diagram which categorizes different types of Metaheuristics.
Henri Milne -Edwards's (1844) diagram of relationships of vertebrate animals, illustrated as a series of nested sets.
A diagram is a symbolic representation of information using visualization techniques. Diagrams have been used since prehistoric times on walls of caves, but became more prevalent during the Enlightenment. Sometimes, the technique uses a three-dimensional visualization which is then projected onto a two-dimensional surface. The word graph is sometimes used as a synonym for diagram.
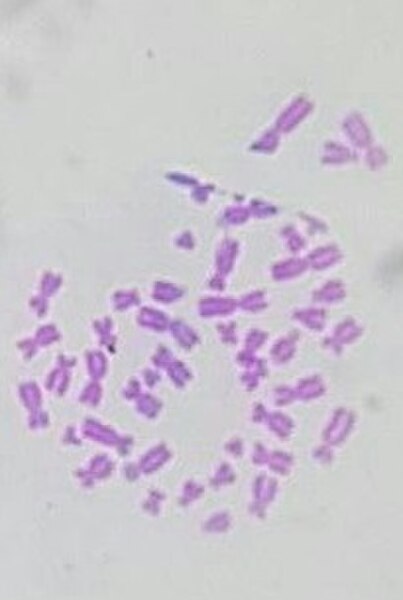
Photomicrograph of the human chromosomes


