Gas exchange
Videos
Gas exchange is the physiological process by which gases move passively by diffusion across a surface. For example, this surface might be the air/water interface of a water body, the surface of a gas

Fig. 6. A diagrammatic histological cross-section through a portion of lung tissue showing a normally inflated alveolus (at the end of a normal exhalation), and its walls containing the alveolar capillaries (shown in cross-section). This illustrates how the alveolar capillary blood is completely surrounded by alveolar air. In a normal human lung all the alveoli together contain about 3 liters of alveolar air. All the alveolar capillaries contain about 100 ml blood.

Fig. 7. A highly diagrammatic illustration of the process of gas exchange in the mammalian lungs, emphasizing the differences between the gas compositions of the ambient air, the alveolar air (light blue) with which the alveolar capillary blood equilibrates, and the blood gas tensions in the pulmonary arterial (blue blood entering the lung on the left) and venous blood (red blood leaving the lung on the right). All the gas tensions are in kPa. To convert to mm Hg, multiply by 7.5.

Fig. 8. Gills of tuna showing filaments and lamellae

Fig. 9. A diagrammatic representation of the cross-current respiratory gas exchanger in the lungs of birds. Air is forced from the air sacs unidirectionally (from right to left in the diagram) through the parabronchi. The pulmonary capillaries surround the parabronchi in the manner shown (blood flowing from below the parabronchus to above it in the diagram). Blood or air with a high oxygen content is shown in red; oxygen-poor air or blood is shown in various shades of purple-blue.
Respiratory system
Videos
The respiratory system is a biological system consisting of specific organs and structures used for gas exchange in animals and plants.
Fig. 1. Respiratory system
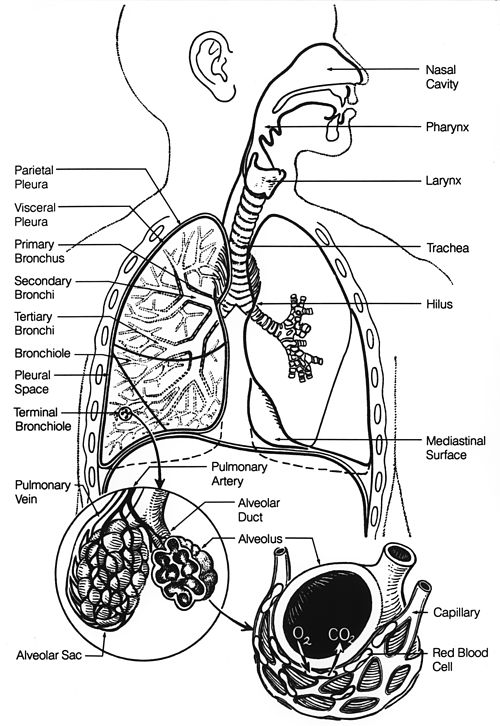

Fig. 2. The lower respiratory tract, or "Respiratory Tree" Trachea Mainstem bronchus Lobar bronchus Segmental bronchus Bronchiole Alveolar duct Alveolus

Fig. 4 The effect of the muscles of inhalation in expanding the rib cage. The particular action illustrated here is called the pump handle movement of the rib cage.

Fig. 7 The muscles of breathing at rest: inhalation on the left, exhalation on the right. Contracting muscles are shown in red; relaxed muscles in blue. Contraction of the diaphragm generally contributes the most to the expansion of the chest cavity (light blue). However, at the same time, the intercostal muscles pull the ribs upwards (their effect is indicated by arrows) also causing the rib cage to expand during inhalation (see diagram on other side of the page). The relaxation of all these muscles during exhalation causes the rib cage and abdomen (light green) to elastically return to their resting positions. Compare with Fig. 6, the MRI video of the chest movements during the breathing cycle.