In statistics, the logistic model is a statistical model that models the log-odds of an event as a linear combination of one or more independent variables. In regression analysis, logistic regression is estimating the parameters of a logistic model. Formally, in binary logistic regression there is a single binary dependent variable, coded by an indicator variable, where the two values are labeled "0" and "1", while the independent variables can each be a binary variable or a continuous variable. The corresponding probability of the value labeled "1" can vary between 0 and 1, hence the labeling; the function that converts log-odds to probability is the logistic function, hence the name. The unit of measurement for the log-odds scale is called a logit, from logistic unit, hence the alternative names. See § Background and § Definition for formal mathematics, and § Example for a worked example.
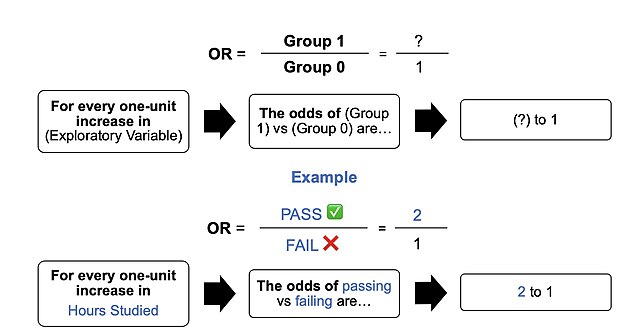
The image represents an outline of what an odds ratio looks like in writing, through a template in addition to the test score example in the "Example" section of the contents. In simple terms, if we hypothetically get an odds ratio of 2 to 1, we can say... "For every one-unit increase in hours studied, the odds of passing (group 1) or failing (group 0) are (expectedly) 2 to 1 (Denis, 2019).
A logistic function or logistic curve is a common S-shaped curve with the equation
Pierre-François Verhulst (1804–1849)
Generalized logistic function (Richards growth curve) in epidemiological modeling
Extrapolated infection trajectories of 40 countries severely affected by COVID-19 and grand (population) average through May 14th


