A market trend is a perceived tendency of the financial markets to move in a particular direction over time. Analysts classify these trends as secular for long time-frames, primary for medium time-frames, and secondary for short time-frames. Traders attempt to identify market trends using technical analysis, a framework which characterizes market trends as predictable price tendencies within the market when price reaches support and resistance levels, varying over time.
Statues of the two symbolic beasts of finance, the bear and the bull, in front of the Frankfurt Stock Exchange
A 1901 cartoon depicting financier J. P. Morgan as a bull with eager investors
Sculpture of stock market bear outside International Financial Services Centre, Dublin
The Battle of the Bulls and Bears (Harper's Weekly, September 10, 1864)
In finance, technical analysis is an analysis methodology for analysing and forecasting the direction of prices through the study of past market data, primarily price and volume. As a type of active management, it stands in contradiction to much of modern portfolio theory. The efficacy of technical analysis is disputed by the efficient-market hypothesis, which states that stock market prices are essentially unpredictable, and research on whether technical analysis offers any benefit has produced mixed results. It is distinguished from fundamental analysis, which considers a company's financial statements, health, and the overall state of the market and economy.
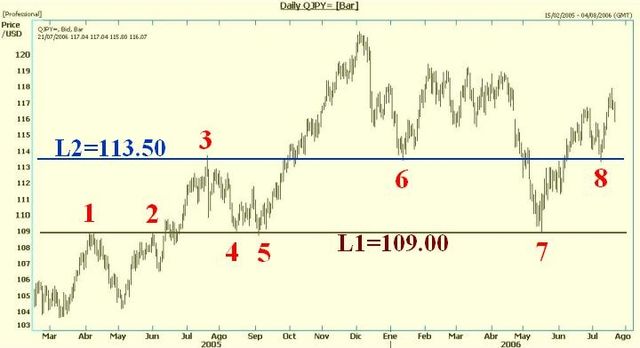
Stock chart showing levels of support (4, 5, 6, 7, and 8) and resistance (1, 2, and 3). Therefore, of resistance tend to become levels of support and vice versa.[citation needed]
Temporal representation of hindcasting