Ocean acidification
Videos
Ocean acidification is the ongoing decrease in the pH of the Earth's ocean. Over the past 200 years, the rapid increase in anthropogenic CO2 (carbon dioxide) production has led to an increase in the acidity of the Earth’s oceans. Between 1950 and 2020, the average pH of the ocean surface fell from approximately 8.15 to 8.05. Carbon dioxide emissions from human activities are the primary cause of ocean acidification, with atmospheric carbon dioxide (CO2) levels exceeding 410 ppm (in 2020). CO2 from the atmosphere is absorbed by the oceans. This chemical reaction produces carbonic acid (H2CO3) which dissociates into a bicarbonate ion (HCO−3) and a hydrogen ion (H+). The presence of free hydrogen ions (H+) lowers the pH of the ocean, increasing acidity (this does not mean that seawater is acidic yet; it is still alkaline, with a pH higher than 8). Marine calcifying organisms, such as mollusks and corals, are especially vulnerable because they rely on calcium carbonate to build shells and skeletons.

This diagram of the fast carbon cycle shows the movement of carbon between land, atmosphere, and oceans. Yellow numbers are natural fluxes, and red are human contributions in gigatons of carbon per year. White numbers indicate stored carbon.

Various types of foraminifera observed through a microscope using differential interference contrast.

Distribution of (A) aragonite and (B) calcite saturation depth in the global oceans

Time series of atmospheric CO2 at Mauna Loa (in parts per million volume, ppmv; red), surface ocean pCO2 (µatm; blue) and surface ocean pH (green) at Ocean Station ALOHA in the subtropical North Pacific Ocean.
Fossil fuel
Videos
A fossil fuel is a hydrocarbon-containing material such as coal, oil, and natural gas, formed naturally in the Earth's crust from the remains of dead plants and animals that is extracted and burned as a fuel. Fossil fuels may be burned to provide heat for use directly, to power engines, or to generate electricity. Some fossil fuels are refined into derivatives such as kerosene, gasoline and propane before burning. The origin of fossil fuels is the anaerobic decomposition of buried dead organisms, containing organic molecules created by photosynthesis. The conversion from these materials to high-carbon fossil fuels typically requires a geological process of millions of years.
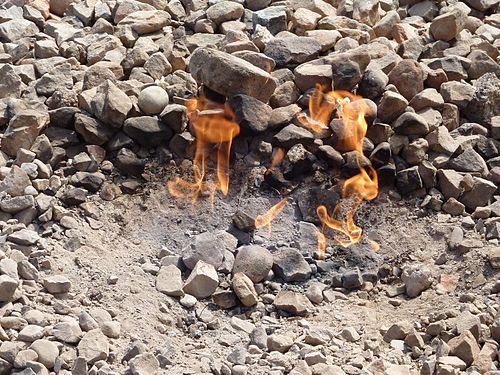
Image: Chuhuo

Image: Petroleum sample

Image: Bituminous Coal