Microwave
Microwaves are a form of electromagnetic radiation with wavelengths ranging from about one meter to one millimeter. Different sources define different frequency ranges as microwaves. A more common definition in radio engineering is the range between 100 GHz. In all cases, microwaves include the entire SHF band at minimum. Frequencies in the microwave range are referred to by their IEEE radar band designations: S, C, X, Ku, K, or Ka band, or by similar NATO or EU designations; the prefix micro- in microwave is not meant to suggest a wavelength in the micrometer range. Rather, it indicates that microwaves are "small", compared to the radio waves used prior to microwave technology; the boundaries between far infrared, terahertz radiation and ultra-high-frequency radio waves are arbitrary and are used variously between different fields of study. Microwaves travel by line-of-sight. At the high end of the band they are absorbed by gases in the atmosphere, limiting practical communication distances to around a kilometer.
Microwaves are used in modern technology, for example in point-to-point communication links, wireless networks, microwave radio relay networks, radar and spacecraft communication, medical diathermy and cancer treatment, remote sensing, radio astronomy, particle accelerators, industrial heating, collision avoidance systems, garage door openers and keyless entry systems, for cooking food in microwave ovens. Microwaves occupy a place in the electromagnetic spectrum with frequency above ordinary radio waves, below infrared light: In descriptions of the electromagnetic spectrum, some sources classify microwaves as radio waves, a subset of the radio wave band; this is an arbitrary distinction. Microwaves travel by line-of-sight paths. Although at the low end of the band they can pass through building walls enough for useful reception rights of way cleared to the first Fresnel zone are required. Therefore, on the surface of the Earth, microwave communication links are limited by the visual horizon to about 30–40 miles.
Microwaves are absorbed by moisture in the atmosphere, the attenuation increases with frequency, becoming a significant factor at the high end of the band. Beginning at about 40 GHz, atmospheric gases begin to absorb microwaves, so above this frequency microwave transmission is limited to a few kilometers. A spectral band structure causes absorption peaks at specific frequencies. Above 100 GHz, the absorption of electromagnetic radiation by Earth's atmosphere is so great that it is in effect opaque, until the atmosphere becomes transparent again in the so-called infrared and optical window frequency ranges. In a microwave beam directed at an angle into the sky, a small amount of the power will be randomly scattered as the beam passes through the troposphere. A sensitive receiver beyond the horizon with a high gain antenna focused on that area of the troposphere can pick up the signal; this technique has been used at frequencies between 0.45 and 5 GHz in tropospheric scatter communication systems to communicate beyond the horizon, at distances up to 300 km.
The short wavelengths of microwaves allow omnidirectional antennas for portable devices to be made small, from 1 to 20 centimeters long, so microwave frequencies are used for wireless devices such as cell phones, cordless phones, wireless LANs access for laptops, Bluetooth earphones. Antennas used include short whip antennas, rubber ducky antennas, sleeve dipoles, patch antennas, the printed circuit inverted F antenna used in cell phones, their short wavelength allows narrow beams of microwaves to be produced by conveniently small high gain antennas from a half meter to 5 meters in diameter. Therefore, beams of microwaves are used for point-to-point communication links, for radar. An advantage of narrow beams is that they don't interfere with nearby equipment using the same frequency, allowing frequency reuse by nearby transmitters. Parabolic antennas are the most used directive antennas at microwave frequencies, but horn antennas, slot antennas and dielectric lens antennas are used. Flat microstrip antennas are being used in consumer devices.
Another directive antenna practical at microwave frequencies is the phased array, a computer-controlled array of antennas which produces a beam which can be electronically steered in different directions. At microwave frequencies, the transmission lines which are used to carry lower frequency radio waves to and from antennas, such as coaxial cable and parallel wire lines, have excessive power losses, so when low attenuation is required microwaves are carried by metal pipes called waveguides. Due to the high cost and maintenance requirements of waveguide runs, in many microwave antennas the output stage of the transmitter or the RF front end of the receiver is located at the antenna; the term microwave has a more technical meaning in electromagnetics and circuit theory. Apparatus and techniques may
Gamma ray
A gamma ray or gamma radiation, is a penetrating electromagnetic radiation arising from the radioactive decay of atomic nuclei. It consists of the shortest wavelength electromagnetic waves and so imparts the highest photon energy. Paul Villard, a French chemist and physicist, discovered gamma radiation in 1900 while studying radiation emitted by radium. In 1903, Ernest Rutherford named this radiation gamma rays based on their strong penetration of matter. Gamma rays from radioactive decay are in the energy range from a few keV to ~8 MeV, corresponding to the typical energy levels in nuclei with reasonably long lifetimes; the energy spectrum of gamma rays can be used to identify the decaying radionuclides using gamma spectroscopy. Very-high-energy gamma rays in the 100–1000 TeV range have been observed from sources such as the Cygnus X-3 microquasar. Natural sources of gamma rays originating on Earth are as a result of radioactive decay and secondary radiation from atmospheric interactions with cosmic ray particles.
However there are other rare natural sources, such as terrestrial gamma-ray flashes, that produce gamma rays from electron action upon the nucleus. Notable artificial sources of gamma rays include fission, such as occurs in nuclear reactors, as well as high energy physics experiments, such as neutral pion decay and nuclear fusion. Gamma rays and X-rays are both electromagnetic radiation and they overlap in the electromagnetic spectrum, the terminology varies between scientific disciplines. In some fields of physics, they are distinguished by their origin: Gamma rays are created by nuclear decay, while in the case of X-rays, the origin is outside the nucleus. In astrophysics, gamma rays are conventionally defined as having photon energies above 100 keV and are the subject of gamma ray astronomy, while radiation below 100 keV is classified as X-rays and is the subject of X-ray astronomy; this convention stems from the early man-made X-rays, which had energies only up to 100 keV, whereas many gamma rays could go to higher energies.
A large fraction of astronomical gamma rays are screened by Earth's atmosphere. Gamma rays are thus biologically hazardous. Due to their high penetration power, they can damage internal organs. Unlike alpha and beta rays, they pass through the body and thus pose a formidable radiation protection challenge, requiring shielding made from dense materials such as lead or concrete; the first gamma ray source to be discovered was the radioactive decay process called gamma decay. In this type of decay, an excited nucleus emits a gamma ray immediately upon formation. Paul Villard, a French chemist and physicist, discovered gamma radiation in 1900, while studying radiation emitted from radium. Villard knew that his described radiation was more powerful than described types of rays from radium, which included beta rays, first noted as "radioactivity" by Henri Becquerel in 1896, alpha rays, discovered as a less penetrating form of radiation by Rutherford, in 1899. However, Villard did not consider naming them as a different fundamental type.
In 1903, Villard's radiation was recognized as being of a type fundamentally different from named rays by Ernest Rutherford, who named Villard's rays "gamma rays" by analogy with the beta and alpha rays that Rutherford had differentiated in 1899. The "rays" emitted by radioactive elements were named in order of their power to penetrate various materials, using the first three letters of the Greek alphabet: alpha rays as the least penetrating, followed by beta rays, followed by gamma rays as the most penetrating. Rutherford noted that gamma rays were not deflected by a magnetic field, another property making them unlike alpha and beta rays. Gamma rays were first thought to be particles like alpha and beta rays. Rutherford believed that they might be fast beta particles, but their failure to be deflected by a magnetic field indicated that they had no charge. In 1914, gamma rays were observed to be reflected from crystal surfaces, proving that they were electromagnetic radiation. Rutherford and his co-worker Edward Andrade measured the wavelengths of gamma rays from radium, found that they were similar to X-rays, but with shorter wavelengths and higher frequency.
This was recognized as giving them more energy per photon, as soon as the latter term became accepted. A gamma decay was understood to emit a gamma photon. Natural sources of gamma rays on Earth include gamma decay from occurring radioisotopes such as potassium-40, as a secondary radiation from various atmospheric interactions with cosmic ray particles; some rare terrestrial natural sources that produce gamma rays that are not of a nuclear origin, are lightning strikes and terrestrial gamma-ray flashes, which produce high energy emissions from natural high-energy voltages. Gamma rays are produced by a number of astronomical processes in which high-energy electrons are produced; such electrons produce secondary gamma rays by the mechanisms of bremsstrahlung, inverse Compton scattering and synchrotron radiation. A large fraction of such astronomical gamma rays are screened by Earth's atmosphere. Notable artificial sources of gamma rays include fission, such as occurs in nuclear reactors, as well as high energy physics experiments, such as neutral pion decay and nuclear fusion.
A sample of gamma ray-emitting material, used for irradiating or imaging is known as a gamma source. It is called a radioactive sou
Spectrum analyzer
A spectrum analyzer measures the magnitude of an input signal versus frequency within the full frequency range of the instrument. The primary use is to measure the power of the spectrum of known and unknown signals; the input signal. Optical spectrum analyzers exist, which use direct optical techniques such as a monochromator to make measurements. By analyzing the spectra of electrical signals, dominant frequency, distortion, harmonics and other spectral components of a signal can be observed that are not detectable in time domain waveforms; these parameters are useful in the characterization of electronic devices, such as wireless transmitters. The display of a spectrum analyzer has frequency on the horizontal axis and the amplitude displayed on the vertical axis. To the casual observer, a spectrum analyzer looks like an oscilloscope and, in fact, some lab instruments can function either as an oscilloscope or a spectrum analyzer; the first spectrum analyzers, in the 1960s, were swept-tuned instruments.
Following the discovery of the fast Fourier transform in 1965, the first FFT-based analyzers were introduced in 1967. Today, there are three basic types of analyzer: the swept-tuned spectrum analyzer, the vector signal analyzer, the real-time spectrum analyzer. Spectrum analyzer types are distinguished by the methods used to obtain the spectrum of a signal. There are swept-tuned and Fast Fourier Transform based spectrum analyzers: A swept-tuned analyzer uses a superheterodyne receiver to down-convert a portion of the input signal spectrum to the center frequency of a narrow band-pass filter, whose instantaneous output power is recorded or displayed as a function of time. By sweeping the receiver's center-frequency through a range of frequencies, the output is a function of frequency, but while the sweep centers on any particular frequency, it may be missing short-duration events at other frequencies. An FFT analyzer computes a time-sequence of periodograms. FFT refers to a particular mathematical algorithm used in the process.
This is used in conjunction with a receiver and analog-to-digital converter. As above, the receiver reduces the center-frequency of a portion of the input signal spectrum, but the portion is not swept; the purpose of the receiver is to reduce the sampling rate. With a sufficiently low sample-rate, FFT analyzers can process all the samples, are therefore able to avoid missing short-duration events. Spectrum analyzers tend to fall into four form factors: benchtop, portable and networked; this form factor is useful for applications where the spectrum analyzer can be plugged into AC power, which means in a lab environment or production/manufacturing area. Bench top spectrum analyzers have offered better performance and specifications than the portable or handheld form factor. Bench top spectrum analyzers have multiple fans to dissipate heat produced by the processor. Due to their architecture, bench top spectrum analyzers weigh more than 30 pounds; some bench top spectrum analyzers offer optional battery packs, allowing them to be used away from AC power.
This type of analyzer is referred to as a "portable" spectrum analyzer. This form factor is useful for any applications where the spectrum analyzer needs to be taken outside to make measurements or carried while in use. Attributes that contribute to a useful portable spectrum analyzer include: Optional battery-powered operation to allow the user to move outside. Viewable display to allow the screen to be read in bright sunlight, darkness or dusty conditions.. Light weight; this form factor is useful for any application where the spectrum analyzer needs to be light and small. Handheld analyzers offer a limited capability relative to larger systems. Attributes that contribute to a useful handheld spectrum analyzer include: Very low power consumption. Battery-powered operation while in the field to allow the user to move outside. Small size Light weight; this form factor does not include a display and these devices are designed to enable a new class of geographically-distributed spectrum monitoring and analysis applications.
The key attribute is the ability to connect the analyzer to a network and monitor such devices across a network. While many spectrum analyzers have an Ethernet port for control, they lack efficient data transfer mechanisms and are too bulky or expensive to be deployed in such a distributed manner. Key applications for such devices include RF intrusion detection systems for secure facilities where wireless signaling is prohibited; as well cellular operators are using such analyzers to remotely monitor interference in licensed spectral bands. The distributed nature of such devices enable geo-location of transmitters, spectrum monitoring for dynamic spectrum access and many other such applications. Key attributes of such devices include: Network-efficient data transfer Low power consumption The ability to synchronize data captures across a network of analyzers Low cost to enable mass deployment; as discussed above in types, a swept-tuned spectrum analyzer down-converts a portion of the input signal spectrum to the center frequency of a band-pass filter by sweeping the voltage-controlled oscillator through a range of frequencies, enabling the consideration of the full frequency range of the instrument.
Th
Amici prism
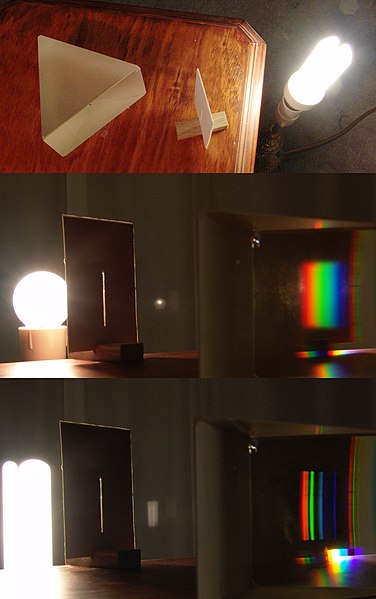
An Amici prism, named for the astronomer Giovanni Amici, is a type of compound dispersive prism used in spectrometers. The Amici prism consists of two triangular prisms in contact, with the first being made from a medium-dispersion crown glass, the second a higher-dispersion flint glass. Light entering the first prism is refracted at the first air-glass interface, refracted again at the interface between the two prisms, exits the second prism at near-normal incidence; the prism angles and materials are chosen such that one wavelength of light, the centre wavelength, exits the prism parallel to the entrance beam. The prism assembly is thus a direct-vision prism, is used as such in hand-held spectroscopes. Other wavelengths are deflected at angles depending on the glass dispersion of the materials. Looking at a light source through the prism thus shows the optical spectrum of the source. By 1860, Amici realized that one can join this type of prism back-to-back with a reflected copy of itself, producing a three-prism arrangement known as a double Amici prism.
This doubling of the original prism increases the angular dispersion of the assembly, has the useful property that the centre wavelength is refracted back into the direct line of the entrance beam. The exiting ray of the center wavelength is thus not only undeviated from the incident ray, but experiences no translation away from the incident ray's path. Amici himself never published about his nondeviating prism, but rather communicated the idea to his friend Donati, who constructed the device for observations of stellar spectra. Donati's publications of his observations were the first disclosure of the prism doubling idea, because the prism was practical to build and much more compact than multiple prism arrangements typical of that period for producing high spectral dispersion, Amici's invention caught the attention of researchers throughout Europe. However, the dispersion of Amici prisms can be calculated using the multiple-prism dispersion theory assuming no spatial separation between the prism components.
The dispersive Amici prism should not be confused with the non-dispersive Amici roof prism
Polarization (waves)
Polarization is a property applying to transverse waves that specifies the geometrical orientation of the oscillations. In a transverse wave, the direction of the oscillation is perpendicular to the direction of motion of the wave. A simple example of a polarized transverse wave is vibrations traveling along a taut string. Depending on how the string is plucked, the vibrations can be in a vertical direction, horizontal direction, or at any angle perpendicular to the string. In contrast, in longitudinal waves, such as sound waves in a liquid or gas, the displacement of the particles in the oscillation is always in the direction of propagation, so these waves do not exhibit polarization. Transverse waves that exhibit polarization include electromagnetic waves such as light and radio waves, gravitational waves, transverse sound waves in solids. In some types of transverse waves, the wave displacement is limited to a single direction, so these do not exhibit polarization. An electromagnetic wave such as light consists of a coupled oscillating electric field and magnetic field which are always perpendicular.
In linear polarization, the fields oscillate in a single direction. In circular or elliptical polarization, the fields rotate at a constant rate in a plane as the wave travels; the rotation can have two possible directions. Light or other electromagnetic radiation from many sources, such as the sun and incandescent lamps, consists of short wave trains with an equal mixture of polarizations. Polarized light can be produced by passing unpolarized light through a polarizer, which allows waves of only one polarization to pass through; the most common optical materials are isotropic and do not affect the polarization of light passing through them. Some of these are used to make polarizing filters. Light is partially polarized when it reflects from a surface. According to quantum mechanics, electromagnetic waves can be viewed as streams of particles called photons; when viewed in this way, the polarization of an electromagnetic wave is determined by a quantum mechanical property of photons called their spin.
A photon has one of two possible spins: it can either spin in a right hand sense or a left hand sense about its direction of travel. Circularly polarized electromagnetic waves are composed of photons with only one type of spin, either right- or left-hand. Linearly polarized waves consist of photons that are in a superposition of right and left circularly polarized states, with equal amplitude and phases synchronized to give oscillation in a plane. Polarization is an important parameter in areas of science dealing with transverse waves, such as optics, seismology and microwaves. Impacted are technologies such as lasers and optical fiber telecommunications, radar. Most sources of light are classified as incoherent and unpolarized because they consist of a random mixture of waves having different spatial characteristics, frequencies and polarization states. However, for understanding electromagnetic waves and polarization in particular, it is easiest to just consider coherent plane waves. Characterizing an optical system in relation to a plane wave with those given parameters can be used to predict its response to a more general case, since a wave with any specified spatial structure can be decomposed into a combination of plane waves.
And incoherent states can be modeled stochastically as a weighted combination of such uncorrelated waves with some distribution of frequencies and polarizations. Electromagnetic waves, traveling in free space or another homogeneous isotropic non-attenuating medium, are properly described as transverse waves, meaning that a plane wave's electric field vector E and magnetic field H are in directions perpendicular to the direction of wave propagation. By convention, the "polarization" direction of an electromagnetic wave is given by its electric field vector. Considering a monochromatic plane wave of optical frequency f, let us take the direction of propagation as the z axis. Being a transverse wave the E and H fields must contain components only in the x and y directions whereas Ez = Hz = 0. Using complex notation, the instantaneous physical electric and magnetic fields are given by the real parts of the complex quantities occurring in the following equations; as a function of time t and spatial position z these complex fields can be written as: E → =
Spectroscopy
Spectroscopy is the study of the interaction between matter and electromagnetic radiation. Spectroscopy originated through the study of visible light dispersed according to its wavelength, by a prism; the concept was expanded to include any interaction with radiative energy as a function of its wavelength or frequency, predominantly in the electromagnetic spectrum, though matter waves and acoustic waves can be considered forms of radiative energy. Spectroscopic data are represented by an emission spectrum, a plot of the response of interest as a function of wavelength or frequency. Spectroscopy in the electromagnetic spectrum, is a fundamental exploratory tool in the fields of physics and astronomy, allowing the composition, physical structure and electronic structure of matter to be investigated at atomic scale, molecular scale, macro scale, over astronomical distances. Important applications arise from biomedical spectroscopy in the areas of tissue analysis and medical imaging. Spectroscopy and spectrography are terms used to refer to the measurement of radiation intensity as a function of wavelength and are used to describe experimental spectroscopic methods.
Spectral measurement devices are referred to as spectrometers, spectrophotometers, spectrographs or spectral analyzers. Daily observations of color can be related to spectroscopy. Neon lighting is a direct application of atomic spectroscopy. Neon and other noble gases have characteristic emission frequencies. Neon lamps use collision of electrons with the gas to excite these emissions. Inks and paints include chemical compounds selected for their spectral characteristics in order to generate specific colors and hues. A encountered molecular spectrum is that of nitrogen dioxide. Gaseous nitrogen dioxide has a characteristic red absorption feature, this gives air polluted with nitrogen dioxide a reddish-brown color. Rayleigh scattering is a spectroscopic scattering phenomenon. Spectroscopic studies were central to the development of quantum mechanics and included Max Planck's explanation of blackbody radiation, Albert Einstein's explanation of the photoelectric effect and Niels Bohr's explanation of atomic structure and spectra.
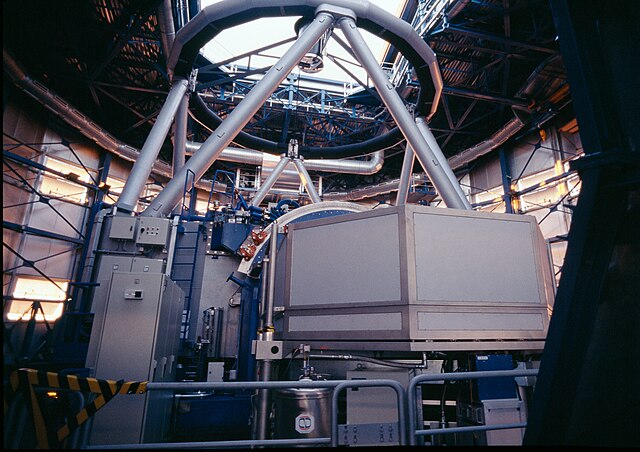
Spectroscopy is used in physical and analytical chemistry because atoms and molecules have unique spectra. As a result, these spectra can be used to detect and quantify information about the atoms and molecules. Spectroscopy is used in astronomy and remote sensing on Earth. Most research telescopes have spectrographs; the measured spectra are used to determine the chemical composition and physical properties of astronomical objects. One of the central concepts in spectroscopy is its corresponding resonant frequency. Resonances were first characterized in mechanical systems such as pendulums. Mechanical systems that vibrate or oscillate will experience large amplitude oscillations when they are driven at their resonant frequency. A plot of amplitude vs. excitation frequency will have a peak centered at the resonance frequency. This plot is one type of spectrum, with the peak referred to as a spectral line, most spectral lines have a similar appearance. In quantum mechanical systems, the analogous resonance is a coupling of two quantum mechanical stationary states of one system, such as an atom, via an oscillatory source of energy such as a photon.
The coupling of the two states is strongest when the energy of the source matches the energy difference between the two states. The energy of a photon is related to its frequency by E = h ν where h is Planck's constant, so a spectrum of the system response vs. photon frequency will peak at the resonant frequency or energy. Particles such as electrons and neutrons have a comparable relationship, the de Broglie relations, between their kinetic energy and their wavelength and frequency and therefore can excite resonant interactions. Spectra of atoms and molecules consist of a series of spectral lines, each one representing a resonance between two different quantum states; the explanation of these series, the spectral patterns associated with them, were one of the experimental enigmas that drove the development and acceptance of quantum mechanics. The hydrogen spectral series in particular was first explained by the Rutherford-Bohr quantum model of the hydrogen atom. In some cases spectral lines are well separated and distinguishable, but spectral lines can overlap and appear to be a single transition if the density of energy states is high enough.
Named series of lines include the principal, sharp and fundamental series. Spectroscopy is a sufficiently broad field that many sub-disciplines exist, each with numerous implementations of specific spectroscopic techniques; the various implementations and techniques can be classified in several ways. The types of spectroscopy are distinguished by the type of radiative energy involved in the interaction. In many applications, the spectrum is determined by measuring changes in the intensity or frequency of this energy; the types of radiative energy studied include: Electromagnetic radiation was the first source of energy used for spectroscopic studies. Techniques that employ electromagnetic radiation are classified by the wavelength region of the spectrum and include microwave, terahe
Rubidium
Rubidium is a chemical element with symbol Rb and atomic number 37. Rubidium is a soft, silvery-white metallic element of the alkali metal group, with a standard atomic weight of 85.4678. Elemental rubidium is reactive, with properties similar to those of other alkali metals, including rapid oxidation in air. On Earth, natural rubidium comprises two isotopes: 72% is the stable isotope, 85Rb. German chemists Robert Bunsen and Gustav Kirchhoff discovered rubidium in 1861 by the newly developed technique, flame spectroscopy; the name comes from the Latin word rubidus, meaning the color of its emission spectrum. Rubidium's compounds have various chemical and electronic applications. Rubidium metal is vaporized and has a convenient spectral absorption range, making it a frequent target for laser manipulation of atoms. Rubidium is not a known nutrient for any living organisms. However, rubidium ions have the same charge as potassium ions, are taken up and treated by animal cells in similar ways. Rubidium is a soft, silvery-white metal.
It is the second most electropositive of the stable alkali metals and melts at a temperature of 39.3 °C. Like other alkali metals, rubidium metal reacts violently with water; as with potassium and caesium, this reaction is vigorous enough to ignite the hydrogen gas it produces. Rubidium has been reported to ignite spontaneously in air, it forms amalgams with mercury and alloys with gold, caesium and potassium, but not lithium. Rubidium has a low ionization energy of only 406 kJ/mol. Rubidium and potassium show a similar purple color in the flame test, distinguishing the two elements requires more sophisticated analysis, such as spectroscopy. Rubidium chloride is the most used rubidium compound: among several other chlorides, it is used to induce living cells to take up DNA. Other common rubidium compounds are the corrosive rubidium hydroxide, the starting material for most rubidium-based chemical processes. Rubidium silver iodide has the highest room temperature conductivity of any known ionic crystal, a property exploited in thin film batteries and other applications.
Rubidium forms a number of oxides when exposed to air, including rubidium monoxide, Rb6O, Rb9O2. Rubidium forms salts with halides, producing rubidium fluoride, rubidium chloride, rubidium bromide, rubidium iodide. Although rubidium is monoisotopic, rubidium in the Earth's crust is composed of two isotopes: the stable 85Rb and the radioactive 87Rb. Natural rubidium is radioactive, with specific activity of about 670 Bq/g, enough to expose a photographic film in 110 days. Twenty four additional rubidium isotopes have been synthesized with half-lives of less than 3 months. Rubidium-87 has a half-life of 48.8×10⁹ years, more than three times the age of the universe of ×109 years, making it a primordial nuclide. It substitutes for potassium in minerals, is therefore widespread. Rb has been used extensively in dating rocks. During fractional crystallization, Sr tends to concentrate in plagioclase, leaving Rb in the liquid phase. Hence, the Rb/Sr ratio in residual magma may increase over time, the progressing differentiation results in rocks with elevated Rb/Sr ratios.
The highest ratios occur in pegmatites. If the initial amount of Sr is known or can be extrapolated the age can be determined by measurement of the Rb and Sr concentrations and of the 87Sr/86Sr ratio; the dates indicate the true age of the minerals only if the rocks have not been subsequently altered. Rubidium-82, one of the element's non-natural isotopes, is produced by electron-capture decay of strontium-82 with a half-life of 25.36 days. With a half-life of 76 seconds, rubidium-82 decays by positron emission to stable krypton-82. Rubidium is the twenty-third most abundant element in the Earth's crust as abundant as zinc and rather more common than copper, it occurs in the minerals leucite, pollucite and zinnwaldite, which contain as much as 1% rubidium oxide. Lepidolite contains between 0.3% and 3.5% rubidium, is the commercial source of the element. Some potassium minerals and potassium chlorides contain the element in commercially significant quantities. Seawater contains an average of 125 µg/L of rubidium compared to the much higher value for potassium of 408 mg/L and the much lower value of 0.3 µg/L for caesium.
Because of its large ionic radius, rubidium is one of the "incompatible elements." During magma crystallization, rubidium is concentrated together with its heavier analogue caesium in the liquid phase and crystallizes last. Therefore, the largest deposits of rubidium and caesium are zone pegmatite ore bodies formed by this enrichment process; because rubidium substitutes for potassium in the crystallization of magma, the enrichment is far less effective than that of caesium. Zone pegmatite ore bodies containing mineable quantities of caesium as pollucite or the lithium minerals lepidolite are a source for rubidium as a by-product. Two notable sources of rubidium are th