Polymer
Videos
A polymer is a substance composed of macromolecules. A macromolecule is a molecule of high relative molecular mass, the structure of which essentially comprises the multiple repetition of units derive

Appearance of real linear polymer chains as recorded using an atomic force microscope on a surface, under liquid medium. Chain contour length for this polymer is ~204 nm; thickness is ~0.4 nm.

A polyethylene sample that has necked under tension

A plastic item with thirty years of exposure to heat and cold, brake fluid, and sunlight. Notice the discoloration and crazing of the material (compared with replacement item in foreground).

Chlorine attack of acetal resin plumbing joint
Macromolecule
Videos
A macromolecule is a "molecule of high relative molecular mass, the structure of which essentially comprises the multiple repetition of units derived, actually or conceptually, from molecules of low r
Polymer
…or conceptually, from molecules of low relative molecular mass. A polymer () is a substance or material that consists of very large molecules, or macromolecules, that are constituted by many repeating subunits derived from one or more species of monomers. Due to their broad spectrum of properties, both synthetic…
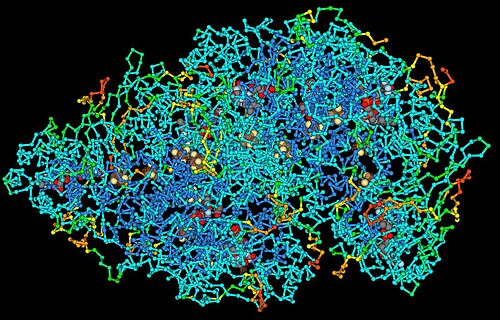
Chemical structure of a polypeptide macromolecule

Structure of an example polyphenylene dendrimer macromolecule