Principal component analysis
Principal component analysis (PCA) is a linear dimensionality reduction technique with applications in exploratory data analysis, visualization and data preprocessing.
The above picture is of a scree plot that is meant to help interpret the PCA and decide how many components to retain. The start of the bend in the line (point of inflexion or "knee") should indicate how many components are retained, hence in this example, three factors should be retained.
The above picture is an example of the difference between PCA and Factor Analysis. In the top diagram the "factor" (e.g., career path) represents the three observed variables (e.g., doctor, lawyer, teacher) whereas in the bottom diagram the observed variables (e.g., pre-school teacher, middle school teacher, high school teacher) are reduced into the component of interest (e.g., teacher).
Iconography of correlations – Geochemistry of marine aerosols
Fractional residual variance (FRV) plots for PCA and NMF; for PCA, the theoretical values are the contribution from the residual eigenvalues. In comparison, the FRV curves for PCA reaches a flat plateau where no signal are captured effectively; while the NMF FRV curves decline continuously, indicating a better ability to capture signal. The FRV curves for NMF also converges to higher levels than PCA, indicating the less-overfitting property of NMF.
Karl Pearson was an English eugenicist, mathematician, and biostatistician. He has been credited with establishing the discipline of mathematical statistics. He founded the world's first university statistics department at University College London in 1911, and contributed significantly to the field of biometrics and meteorology. Pearson was also a proponent of Social Darwinism and eugenics, and his thought is an example of what is today described as scientific racism. Pearson was a protégé and biographer of Sir Francis Galton. He edited and completed both William Kingdon Clifford's Common Sense of the Exact Sciences (1885) and Isaac Todhunter's History of the Theory of Elasticity, Vol. 1 (1886–1893) and Vol. 2 (1893), following their deaths.
Pearson in 1912
Pearson with Sir Francis Galton, 1909 or 1910.
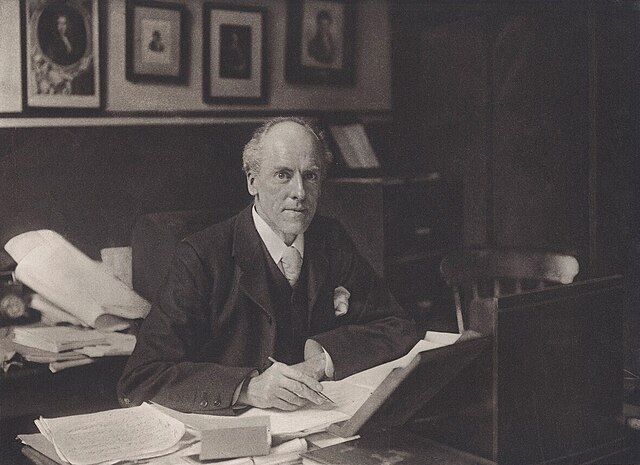
Karl Pearson at work, 1910