A spectrogram is a visual representation of the spectrum of frequencies of a signal as it varies with time.
When applied to an audio signal, spectrograms are sometimes called sonographs, voiceprints, or voicegrams. When the data are represented in a 3D plot they may be called waterfall displays.
A 3D spectrogram: The RF spectrum of a battery charger is shown over time
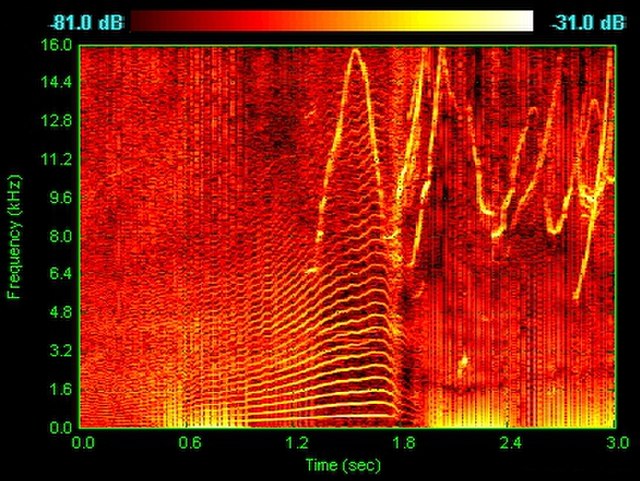
Spectrogram of dolphin vocalizations; chirps, clicks and harmonizing are visible as inverted Vs, vertical lines and horizontal striations respectively.
Spectrogram of an FM signal. In this case the signal frequency is modulated with a sinusoidal frequency vs. time profile.
Spectrogram of great tit song.
Sonar is a technique that uses sound propagation to navigate, measure distances (ranging), communicate with or detect objects on or under the surface of the water, such as other vessels.
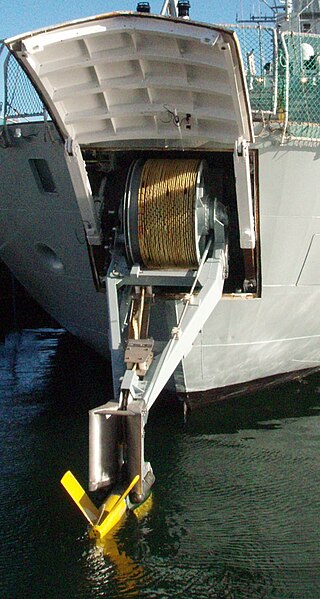
French F70 type frigates (here, La Motte-Picquet) are fitted with VDS (variable depth sonar) type DUBV43 or DUBV43C towed sonars.
Sonar image of the Soviet Navy minesweeper T-297, formerly the Latvian Virsaitis, which was shipwrecked on 3 December 1941 in the Gulf of Finland
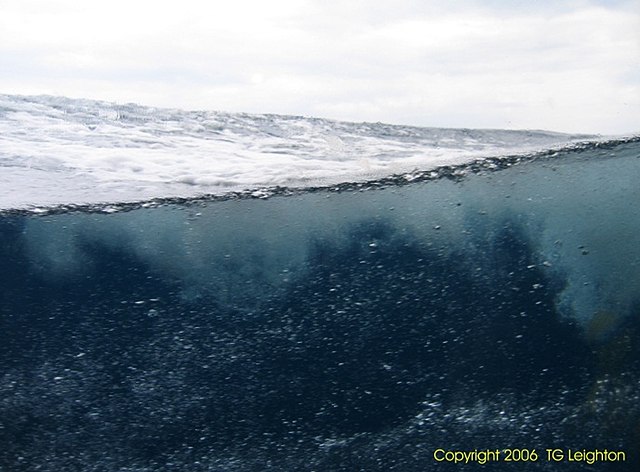
Bubble clouds shown under the sea. From ref.
Variable depth sonar and its winch


