Two-photon excitation microscopy
Two-photon excitation microscopy is a fluorescence imaging technique that is particularly well-suited to image scattering living tissue of up to about one millimeter in thickness. Unlike traditional fluorescence microscopy, where the excitation wavelength is shorter than the emission wavelength, two-photon excitation requires simultaneous excitation by two photons with longer wavelength than the emitted light. The laser is focused onto a specific location in the tissue and scanned across the sample to sequentially produce the image. Due to the non-linearity of two-photon excitation, mainly fluorophores in the micrometer-sized focus of the laser beam are excited, which results in the spatial resolution of the image. This contrasts with confocal microscopy, where the spatial resolution is produced by the interaction of excitation focus and the confined detection with a pinhole.

Two-photon excitation microscopy of mouse intestine. Red: actin. Green: cell nuclei. Blue: mucus of goblet cells. Obtained at 780 nm using a Ti-sapphire laser.
Two-photon fluorescence image (green) of a cross section of rhizome colored with lily of the valley. The excitement is at 840 nm, and the red and blue colors represent other channels of multiphoton techniques which have been superimposed.
Schematic representation of the energy levels (Jabłoński diagrams) of the fluorescence process, example of a fluorescent dye that emits light at 460 nm. One (purple, 1PEF), two (light red, 2PEF) or three (dark red, 3PEF) photons are absorbed to emit a photon of fluorescence (turquoise).
Optical response from a point source. From left to right: calculated intensity distributions xy (top) and rz (bottom), with logarithmic scale, for a point source imaged by means of a wide field (a), 2PEF (b) and confocal microscopy (c). The 2PEF and confocal forms have a better signal-to-noise ratio than the wide field. The 2PEF distribution is larger due to the fact that a wavelength twice as long as in the case of a wide or confocal field is responsible for the intensity distribution. These intensity distributions are also known as point spread functions. Optical conditions: the excitation wavelengths are 488 nm and 900 nm respectively for 1PEF and 2PEF; the emission wavelength is 520 nm; the
A fluorescence microscope is an optical microscope that uses fluorescence instead of, or in addition to, scattering, reflection, and attenuation or absorption, to study the properties of organic or inorganic substances. "Fluorescence microscope" refers to any microscope that uses fluorescence to generate an image, whether it is a simple set up like an epifluorescence microscope or a more complicated design such as a confocal microscope, which uses optical sectioning to get better resolution of the fluorescence image.
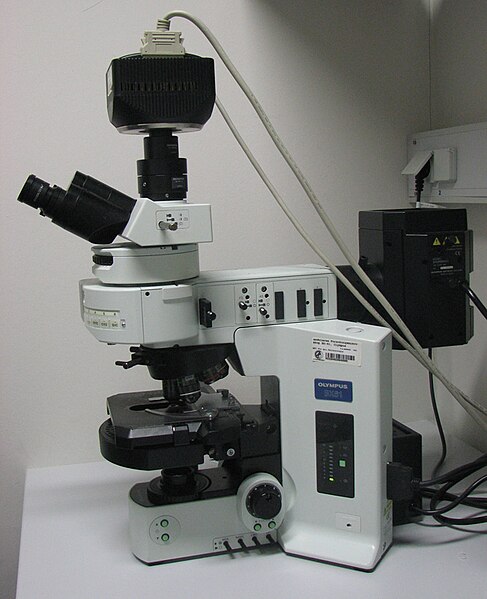
An upright fluorescence microscope (Olympus BX61) with the fluorescence filter cube turret above the objective lenses, coupled with a digital camera.
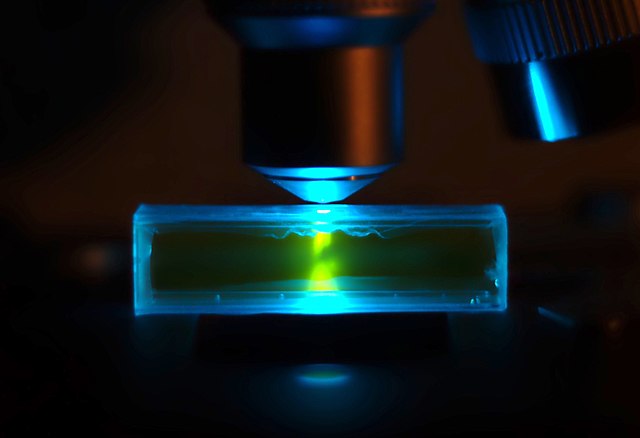
A sample of herring sperm stained with SYBR green in a cuvette illuminated by blue light in an epifluorescence microscope. The SYBR green in the sample binds to the herring sperm DNA and, once bound, fluoresces giving off green light when illuminated by blue light.
Epifluorescent imaging of the three components in a dividing human cancer cell. DNA is stained blue, a protein called INCENP is green, and the microtubules are red. Each fluorophore is imaged separately using a different combination of excitation and emission filters, and the images are captured sequentially using a digital CCD camera, then overlaid to give a complete image.
Endothelial cells under the microscope. Nuclei are stained blue with DAPI, microtubules are marked green by an antibody bound to FITC and actin filaments are labeled red with phalloidin bound to TRITC. Bovine pulmonary artery endothelial (BPAE) cells