In sociology, the upper middle class is the social group constituted by higher status members of the middle class. This is in contrast to the term lower middle class, which is used for the group at the opposite end of the middle-class stratum, and to the broader term middle class. There is considerable debate as to how the upper middle class might be defined. According to sociologist Max Weber, the upper middle class consists of well-educated professionals with postgraduate degrees and comfortable incomes.
Higher education is one of the most distinguishing features of the upper middle class.
The middle class refers to a class of people in the middle of a social hierarchy, often defined by occupation, income, education, or social status. The term has historically been associated with modernity, capitalism and political debate. Common definitions for the middle class range from the middle fifth of individuals on a nation's income ladder, to everyone but the poorest and wealthiest 20%. Theories like "Paradox of Interest" use decile groups and wealth distribution data to determine the size and wealth share of the middle class.
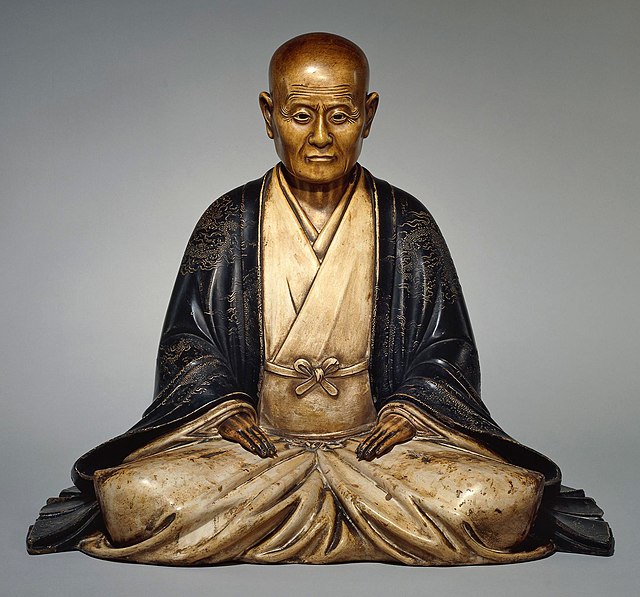
Sculpture of a chōnin, a middle class of mainly merchants that emerged in Japan during the Edo period. Early 18th century.