William Playfair
Videos
William Playfair, a Scottish engineer and political economist, served as a secret agent on behalf of Great Britain during its war with France. The founder of graphical methods of statistics, Playfair invented several types of diagrams: in 1786 the line, area and bar chart of economic data, and in 1801 the pie chart and circle graph, used to show part-whole relations. As a secret agent, Playfair reported on the French Revolution and organized a clandestine counterfeiting operation in 1793 to collapse the French currency.

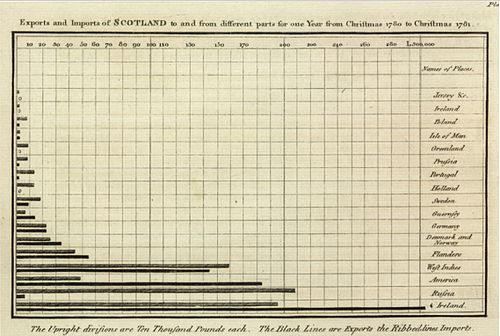
Image: 1786 Playfair Exports and Imports of Scotland to and from different parts for one Year from Christmas 1780 to Christmas 1781
William Henry Playfair
Videos
William Henry Playfair FRSE was a prominent Scottish architect in the 19th century who designed the Eastern, or Third, New Town and many of Edinburgh's neoclassical landmarks.


Playfair's townhouse at 17 Great Stuart Street, Edinburgh

Playfair's grave in Dean Cemetery, Edinburgh

Statue of William Henry Playfair, Chambers Street, Edinburgh