The Atlantic meridional overturning circulation is the main ocean current system in the Atlantic Ocean. It is a component of Earth's ocean circulation system and plays an important role in the climate

In one paper, AMOC collapse only occurs in a full general circulation model after it ran for nearly 2000 years, and freshwater quantities (in Sv) increased to extreme values. While the conditions are unrealistic, the model may also be unrealistically stable, and the full implications are not clear without more real-world observations.

1992–2002 altimeter data from NASA Pathfinder indicated a slowing (red) in the subpolar gyre region. This was used as a proxy for the AMOC before the initiation of RAPID, and before subsequent research demonstrated the subpolar gyre often behaves separately from the larger circulation.

RAPID tracks both the AMOC itself (third line from the top, labelled MOC) as well as its separate components (three lower lines) and the AMOC flow combined with the subpolar gyre and/or the western boundary current flow (upper two lines) AMOC flow during 2004–2008 appears stronger than afterwards.

AMOC is considered to be one of the several major parts of the climate system which could pass tipping point around a certain level of warming and eventually transition to a different state as a result. The graphic shows the levels of warming where this tipping is most likely to occur for a given element.
Younger Dryas
Videos
The Younger Dryas was a period in Earth's geologic history that occurred circa 12,900 to 11,700 years Before Present. It is primarily known for the sudden or "abrupt" cooling in the Northern Hemispher
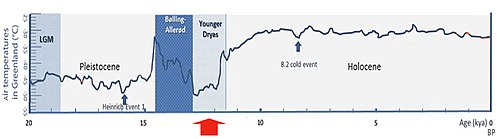
Greenland ice cores since the Last Glacial Maximum show very low temperatures for the most part of the Younger Dryas, which then rise rapidly during the Holocene transition

Dryas octopetala is the indicator species for the period