The atrium is one of the two upper chambers in the heart that receives blood from the circulatory system. The blood in the atria is pumped into the heart ventricles through the atrioventricular mitral and tricuspid heart valves.
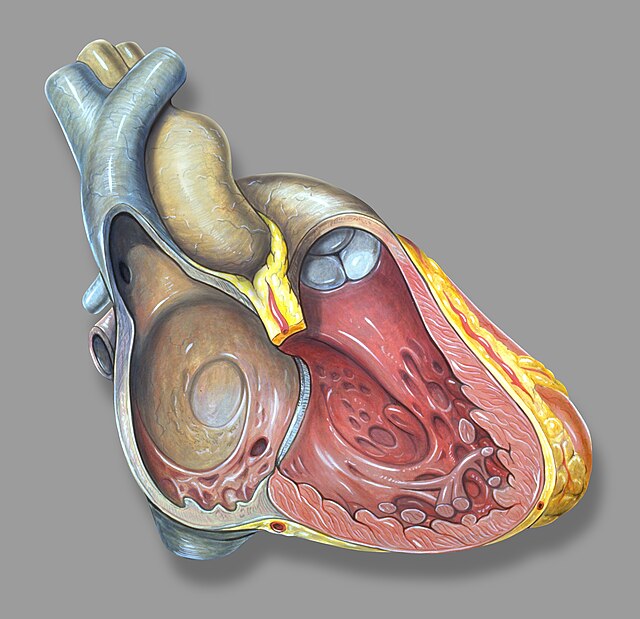
Right heart anatomy, right ventricle seen on right of illustration
Left atrial appendage shown at upper right
CT scan of the chest showing a thrombus in the left atrial appendage (left: axial plane, right: coronal plane)
The cardiac cycle is the performance of the human heart from the beginning of one heartbeat to the beginning of the next. It consists of two periods: one during which the heart muscle relaxes and refills with blood, called diastole, following a period of robust contraction and pumping of blood, called systole. After emptying, the heart relaxes and expands to receive another influx of blood returning from the lungs and other systems of the body, before again contracting to pump blood to the lungs and those systems.
The cycle diagram depicts one heartbeat of the continuously repeating cardiac cycle, namely: ventricular diastole followed by ventricular systole, etc.—while coordinating with atrial systole followed by atrial diastole, etc. The cycle also correlates to key electrocardiogram tracings: the T wave (which indicates ventricular diastole); the P wave (atrial systole); and the QRS 'spikes' complex (ventricular systole)—all shown as color purple-in-black segments.