In biochemistry, the direct linear plot is a graphical method for enzyme kinetics data following the Michaelis–Menten equation. In this plot, observations are not plotted as points, but as lines in parameter space with axes and , such that each observation of a rate at substrate concentration is represented by a straight line with intercept on the axis and on the axis. Ideally the lines intersect at a unique point whose coordinates provide the values of and .
Idealized direct linear plot without experimental error. To avoid crowding and confusion, not all of the rates are indicated explicitly.
In reality, the intersection points in a direct linear plot are subject to experimental error, which may be very large. To avoid overcrowding, only two of the six intersection points are explicitly labelled.
Michaelis–Menten kinetics
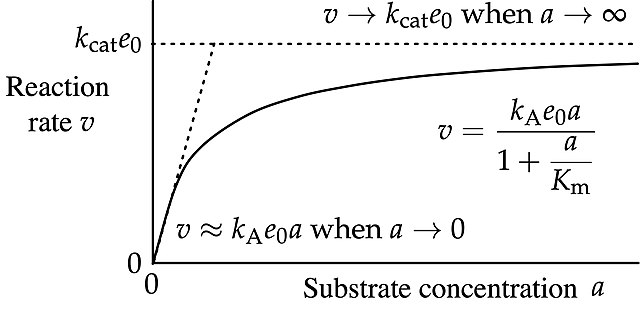
In biochemistry, Michaelis–Menten kinetics, named after Leonor Michaelis and Maud Menten, is the simplest case of enzyme kinetics, applied to enzyme-catalysed reactions of one substrate and one product. It takes the form of a differential equation describing the reaction rate to , the concentration of the substrate A. Its formula is given by the Michaelis–Menten equation:
Curve of the Michaelis–Menten equation labelled in accordance with IUBMB recommendations
Semi-logarithmic plot of Michaelis–Menten data
The reaction changes from approximately first-order in substrate concentration at low concentrations to approximately zeroth order at high concentrations.


