In biochemistry, an Eadie–Hofstee plot is a graphical representation of the Michaelis–Menten equation in enzyme kinetics. It has been known by various different names, including Eadie plot, Hofstee plot and Augustinsson plot. Attribution to Woolf is often omitted, because although Haldane and Stern credited Woolf with the underlying equation, it was just one of the three linear transformations of the Michaelis–Menten equation that they initially introduced. However, Haldane indicated latter that Woolf had indeed found the three linear forms:In 1932, Dr. Kurt Stern published a German translation of my book Enzymes, with numerous additions to the English text. On pp. 119–120, I described some graphical methods, stating that they were due to my friend Dr. Barnett Woolf. [...] Woolf pointed out that linear graphs are obtained when is plotted against , against , or against , the first plot being most convenient unless inhibition is being studied.

Eadie–Hofstee plot of v against v/a for Michaelis–Menten kinetics
Image: Eadie design
Michaelis–Menten kinetics
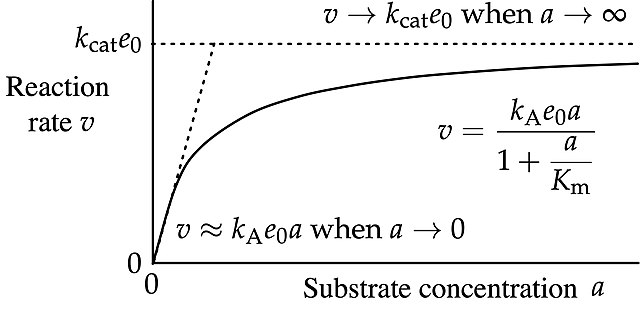
In biochemistry, Michaelis–Menten kinetics, named after Leonor Michaelis and Maud Menten, is the simplest case of enzyme kinetics, applied to enzyme-catalysed reactions of one substrate and one product. It takes the form of a differential equation describing the reaction rate to , the concentration of the substrate A. Its formula is given by the Michaelis–Menten equation:
Curve of the Michaelis–Menten equation labelled in accordance with IUBMB recommendations
Semi-logarithmic plot of Michaelis–Menten data
The reaction changes from approximately first-order in substrate concentration at low concentrations to approximately zeroth order at high concentrations.