The exosphere is a thin, atmosphere-like volume surrounding a planet or natural satellite where molecules are gravitationally bound to that body, but where the density is so low that the molecules are essentially collision-less. In the case of bodies with substantial atmospheres, such as Earth's atmosphere, the exosphere is the uppermost layer, where the atmosphere thins out and merges with outer space. It is located directly above the thermosphere. Very little is known about it due to a lack of research. Mercury, the Moon, Ceres, Europa, and Ganymede have surface boundary exospheres, which are exospheres without a denser atmosphere underneath. The Earth's exosphere is mostly hydrogen and helium, with some heavier atoms and molecules near the base.

Diagram showing the five primary layers of the Earth's atmosphere: exosphere, thermosphere, mesosphere, stratosphere, and troposphere. The layers are to scale. From the Earth's surface to the top of the stratosphere (50km) is just under 1% of Earth's radius.
The Earth and its hydrogen envelope of its exosphere, the geocorona, as seen from the Moon. This ultraviolet picture was taken in 1972 with a camera operated by Apollo 16 astronauts on the Moon.
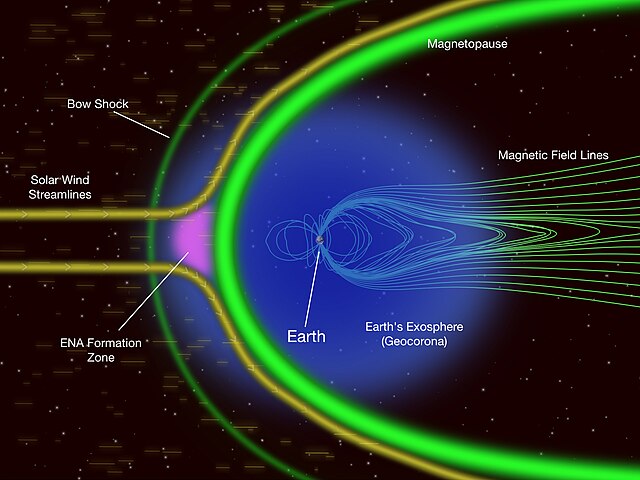
Earth's exosphere, energetic neutral atoms (NEA) and magnetosphere.
The thermosphere is the layer in the Earth's atmosphere directly above the mesosphere and below the exosphere. Within this layer of the atmosphere, ultraviolet radiation causes photoionization/photodissociation of molecules, creating ions; the thermosphere thus constitutes the larger part of the ionosphere. Taking its name from the Greek θερμός meaning heat, the thermosphere begins at about 80 km (50 mi) above sea level. At these high altitudes, the residual atmospheric gases sort into strata according to molecular mass. Thermospheric temperatures increase with altitude due to absorption of highly energetic solar radiation. Temperatures are highly dependent on solar activity, and can rise to 2,000 °C (3,630 °F) or more. Radiation causes the atmospheric particles in this layer to become electrically charged, enabling radio waves to be refracted and thus be received beyond the horizon. In the exosphere, beginning at about 600 km (375 mi) above sea level, the atmosphere turns into space, although, by the judging criteria set for the definition of the Kármán line (100 km), most of the thermosphere is part of space. The border between the thermosphere and exosphere is known as the thermopause.

Earth's night-side upper atmosphere appearing from the bottom as bands of afterglow illuminating the troposphere in orange with silhouettes of clouds, and the stratosphere in white and blue. Next the mesosphere (pink area) extends to the orange and faintly green line of the lowest airglow, at about one hundred kilometers at the edge of space and the lower edge of the thermosphere (invisible). Continuing with green and red bands of aurorae streching over several hundred kilometers.
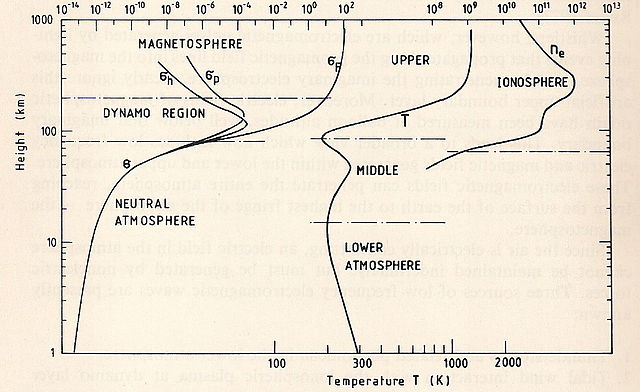
Figure 1. Nomenclature of atmospheric regions based on the profiles of electric conductivity (left), temperature (middle), and electron number density in m−3(right)
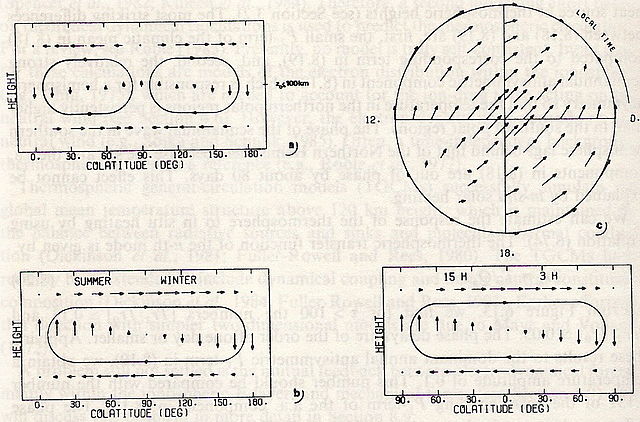
Figure 2. Schematic meridian-height cross-section of circulation of (a) symmetric wind component (P20), (b) of antisymmetric wind component (P10), and (d) of symmetric diurnal wind component (P11) at 3 h and 15 h local time. Upper right panel (c) shows the horizontal wind vectors of the diurnal component in the northern hemisphere depending on local time.


