An extinction event is a widespread and rapid decrease in the biodiversity on Earth. Such an event is identified by a sharp fall in the diversity and abundance of multicellular organisms. It occurs when the rate of extinction increases with respect to the background extinction rate and the rate of speciation. Estimates of the number of major mass extinctions in the last 540 million years range from as few as five to more than twenty. These differences stem from disagreement as to what constitutes a "major" extinction event, and the data chosen to measure past diversity.
Trilobites were highly successful marine animals until the Permian–Triassic extinction event wiped them all out.
Badlands near Drumheller, Alberta, where erosion has exposed the Cretaceous–Paleogene boundary.
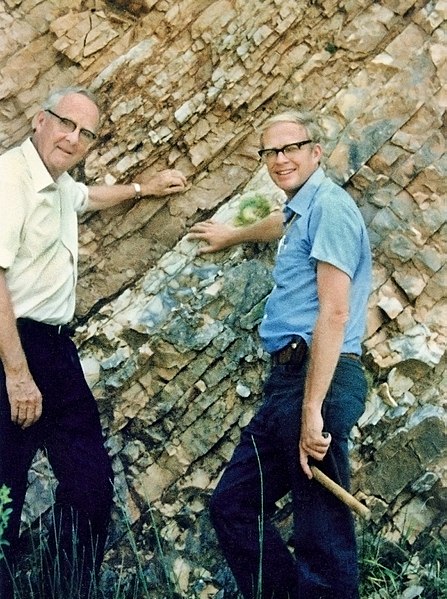
Luis (left) and Walter Alvarez (right) at the K-Pg boundary in Gubbio, Italy in 1981. This team discovered geological evidence for an asteroid impact causing the K-Pg extinction, spurring a wave of public and scientific interest in mass extinctions and their causes
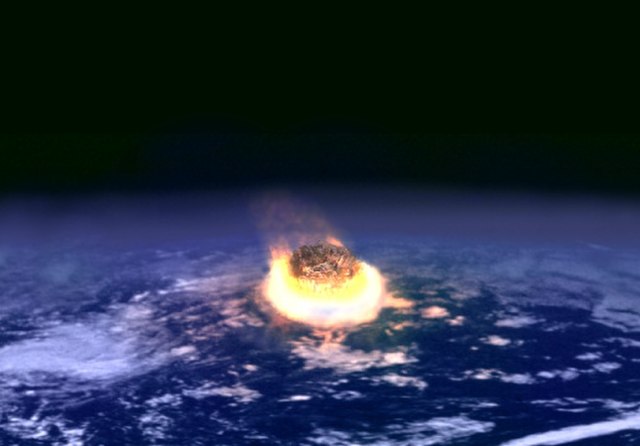
An artist's rendering of an asteroid a few kilometers across colliding with the Earth. Such an impact can release the equivalent energy of several million nuclear weapons detonating simultaneously.
Biodiversity is the variety and variability of life on Earth. It can be measured on various levels. There is for example genetic variability, species diversity, ecosystem diversity and phylogenetic diversity. Diversity is not distributed evenly on Earth. It is greater in the tropics as a result of the warm climate and high primary productivity in the region near the equator. Tropical forest ecosystems cover less than one-fifth of Earth's terrestrial area and contain about 50% of the world's species. There are latitudinal gradients in species diversity for both marine and terrestrial taxa.
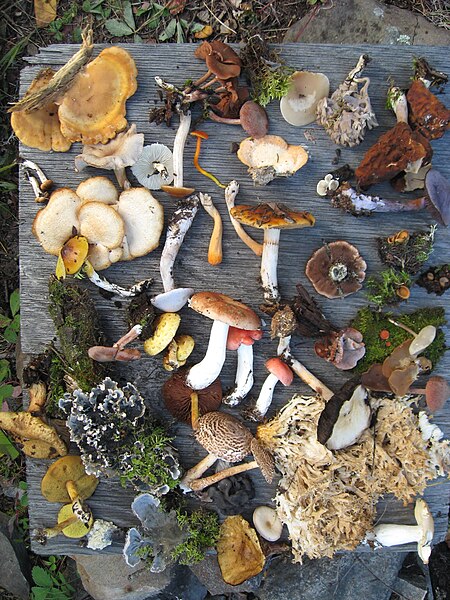
An example of the biodiversity of fungi in a forest in North Saskatchewan (in this photo, there are also leaf lichens and mosses).
Shown in a museum, various models of species across various taxa and orders visualize the variety of life on earth.
Summary of major biodiversity-related environmental-change categories expressed as a percentage of human-driven change (in red) relative to baseline (blue)
Summer field in Belgium (Hamois). The blue flowers are Centaurea cyanus and the red are Papaver rhoeas.


