Relative species abundance
Videos
Relative species abundance is a component of biodiversity and is a measure of how common or rare a species is relative to other species in a defined location or community. Relative abundance is the pe

Figure 4. Generic Rank-abundance diagram of three common mathematical models used to fit species abundance distributions: Motomura's geometric series, Fisher's logseries, and Preston's log-normal series (modified from Magurran 1988).

Figure 5. Plant succession in abandoned fields within Brookhaven National Laboratory, NY. Species abundances conform to the geometric series during early succession but approach lognormal as the community ages. (modified from Whittaker 1972)

Figure 6. An example of Preston's veil. Fish species abundances sampled using repeated trawling over a one-month (blue bars), two month (gold bars) and one-year period (yellow). One year of sampling indicates that the fish community is log-normally distributed. (derived from Magurran 2004)
Central limit theorem
Videos
In probability theory, the central limit theorem states that, under appropriate conditions, the distribution of a normalized version of the sample mean converges to a standard normal distribution. Thi
Relative species abundance
…1948) argued that species abundances (when binned logarithmically in a Preston plot) follow a normal (Gaussian) distribution, partly as a result of the central limit theorem (Figure 4). This means that the abundance distribution is lognormal. According to his argument, the right-skew observed in species abundance frequency…
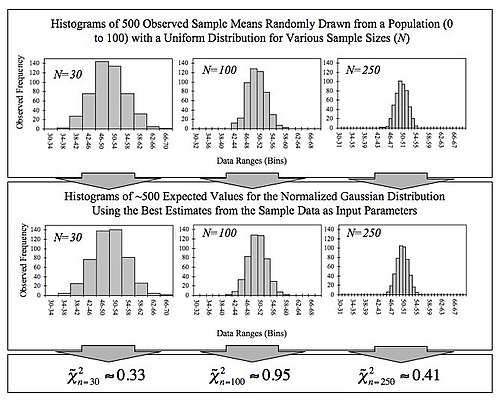
This figure demonstrates the central limit theorem. The sample means are generated using a random number generator, which draws numbers between 0 and 100 from a uniform probability distribution. It illustrates that increasing sample sizes result in the 500 measured sample means being more closely distributed about the population mean (50 in this case). It also compares the observed distributions with the distributions that would be expected for a normalized Gaussian distribution, and shows the