SN Refsdal
Videos
SN Refsdal is the first detected multiply-lensed supernova, visible within the field of the galaxy cluster MACS J1149.5+2223. It was named after Norwegian astrophysicist Sjur Refsdal, who, in 1964, fi

SN Refsdal (inset picture) and galaxy cluster MACS J1149.5+2223

The image to the left shows a part of the deep field observation of the galaxy cluster MACS J1149.5+2223 from the Frontier Fields programme. The circle indicates the predicted position of the newest appearance of the supernova. To the lower right, the Einstein cross event from late 2014 is visible. The image on the top right shows observations by Hubble from October 2015, taken at the beginning of the observation programme to detect the newest appearance of the supernova. The image on the lower right shows the discovery of the supernova on 11 December 2015, as predicted by several different models.

G299 Remnants Super Nova Type 1a 20150218
Hubble's law
Videos
Hubble's law, officially the Hubble–Lemaître law, is the observation in physical cosmology that galaxies are moving away from Earth at speeds proportional to their distance. Thus, the farther a galaxy
SN Refsdal
…supernova to study the expansion of the universe. The observations were made using the Hubble Space Telescope. The host galaxy of SN Refsdal is at a redshift of 1.49, corresponding to a comoving distance of 14.4 billion light-years and a lookback time of 9.34 billion years. The multiple images are arranged…

Three steps to the Hubble constant
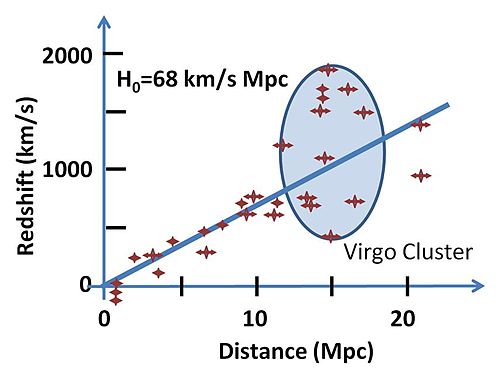
Fit of redshift velocities to Hubble's law. Various estimates for the Hubble constant exist.

A variety of possible recessional velocity vs. redshift functions including the simple linear relation v = cz; a variety of possible shapes from theories related to general relativity; and a curve that does not permit speeds faster than light in accordance with special relativity. All curves are linear at low redshifts.

Bridge diagram showing different measurements of the Hubble constant, 2021